Blog
Which vehicle emissions test cycle is most demanding?
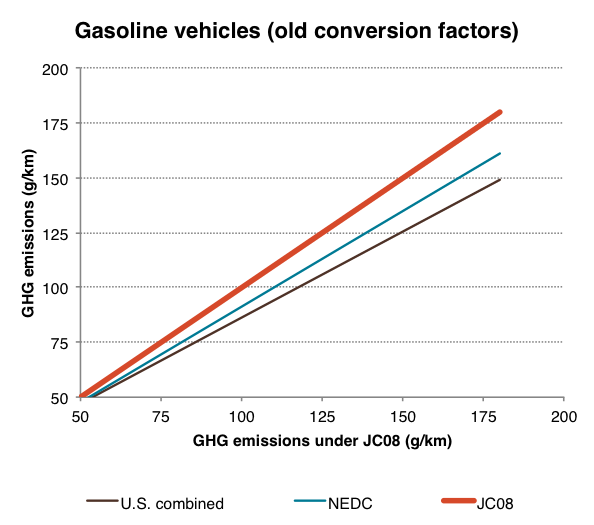
Figure 1. Cycle conversion factors used in previous assessments
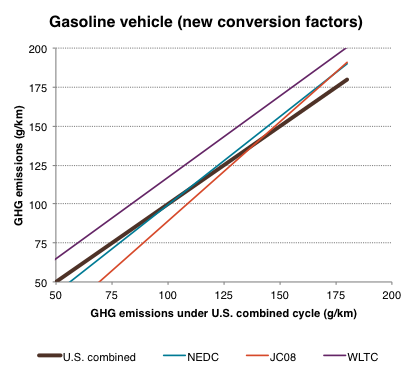
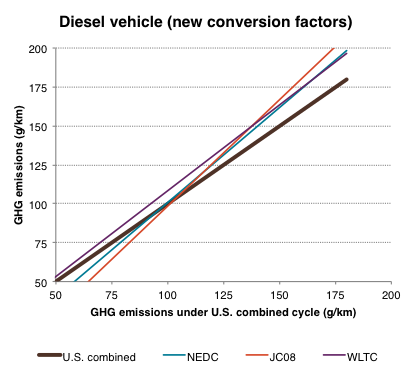
Figure 2. New Gasoline conversion factors Figure 3. New Diesel conversion factors
- The conversion factors change with the fuel economy/CO2 emissions value, and gasoline and diesel vehicles behave very differently under the four test cycles.
- The relative difficulty of the test cycles depends heavily on individual vehicle technology packages. Different vehicle and engine sizes show significant variations in cycle sensitivities. Engine stop/start systems have a major impact on the conversion factors because the proportion of test time spent idling time varies significantly among the driving cycles. Cold start emissions also contribute to differences in cycle difficulty, depending on the engine’s starting temperature and the cycle’s distance.
- For gasoline vehicles, WLTC is most demanding on average for current technology vehicles, with emissions 18% higher than JC08, 15% higher than the US CAFE cycle, and 13% higher than the NEDC. The NEDC and JC08 are more demanding than the US cycles for less-efficient gasoline vehicles. As technologies improve (e.g., stop-start, advanced engine and transmission, hybrid), the differences decrease, and the relative stringency of the NEDC and JC08 cycles versus the US even reverse for vehicles emitting less than 130 g/km. (The WLTC maintains higher emissions than the other cycles for all vehicle efficiency levels.)
- For diesel vehicles, the JC08 and NEDC are almost equal on average, regardless of vehicle efficiency. Both are about 10% more demanding than the US cycles for high-efficiency vehicles, and somewhat less demanding for low-efficiency vehicles. The WLTC matches the JC08 and NEDC for low-efficiency vehicles and matches the US combined cycles for high-efficiency vehicles.
| Old (gasoline) | New (gasoline) | New (diesel) | |
|---|---|---|---|
| NEDC/JC08 | -13% | 5% | -2% |
| US combined/JC08 | -22% | 4% | -7% |
| US combined/NEDC | -11% | -2% | -6% |
| WLTC/JC08 | – | 18% | 0% |
| WLTC/US combined | – | 15% | 9% |
| WLTC/NEDC | – | 13% | 4% |
Table 1. Average vehicle CO2 emissions differences between test cycles in the old and new conversion factors studies (shares of technologies unweighted)
Note that all conclusions reflect only the effects of the drive cycles. The effects of other parameters associated with the test procedures, such as temperature, preconditioning, coast-down, and dynamometer calibration, are not addressed in the simulations. In a recently released ICCT working paper, my colleagues conducted an in-depth assessment of WLTP-NEDC conversion factors to translate the NEDC based EU 2020/21 fleet average CO2 target of 95 g/km. The study took into account two other key elements in the test procedures: vehicle test mass and the engine temperature at test start. All three elements together show that the WLTP test procedure is only 6%–8% more demanding than the current NEDC test procedure in relation to a projected EU fleet composition in 2020.