Blog
Vehicle and fuel standards can dramatically reduce air pollution in Brazil, São Paulo’s air quality data demonstrate
São Paulo’s Environmental Agency, CETESB, announced in February 2017 that new heavy-duty vehicle emissions standards will take effect in Brazil starting in 2019, and as we discussed here, the next logical step is for these standards (called “P-8” in Brazil) to align as closely as possible with the European Union’s Euro VI standards. These standards would achieve a 90% reduction in emissions of particulate matter (PM) and nitrogen oxides (NOX) from new vehicles and lead to cleaner air and fewer health impacts from air pollution.
The Brazilian national government and the state of São Paulo have taken progressive actions since the 1980s to curb air pollution, starting with programs to control sulfur dioxide (SO2) from industrial sources and followed by nationwide standards for cleaner vehicles and fuels (termed PROCONVE).
To track progress on air quality improvements, CETESB has compiled an extensive collection of historical air quality monitoring data and emission inventories for the state of São Paulo. Below, we examine this data to evaluate how successful previous policy actions have been at improving air quality and give a sense of what can be expected from the introduction of Euro VI-equivalent standards in Brazil. Together, the air quality and emission inventory data tell a compelling story of the capacity of standards for cleaner vehicles and fuels to dramatically reduce pollutant emissions and concentrations.
In 2001, motor vehicles and industrial sources emitted 39,400 tons of sulfur oxides (SOX), of which 57% is attributed to motor vehicles. At that time, diesel and gasoline sold in São Paulo were permitted to contain up to 2,000 and 1,000 parts per million (ppm) sulfur, respectively. Since then, these regulated sulfur limits were tightened to 10 ppm for diesel and 50 ppm for gasoline, resulting in proportional reductions in SOX from vehicle tailpipes (see figure below). By 2014, estimated SOX emissions had declined to 1,560 tons from vehicles and 5,600 tons from industrial sources—an 82% reduction from 2001 levels. (Note that CETESB’s methodology for calculating motor vehicle emissions changed in 2010; industrial emissions estimates are for 2008.)
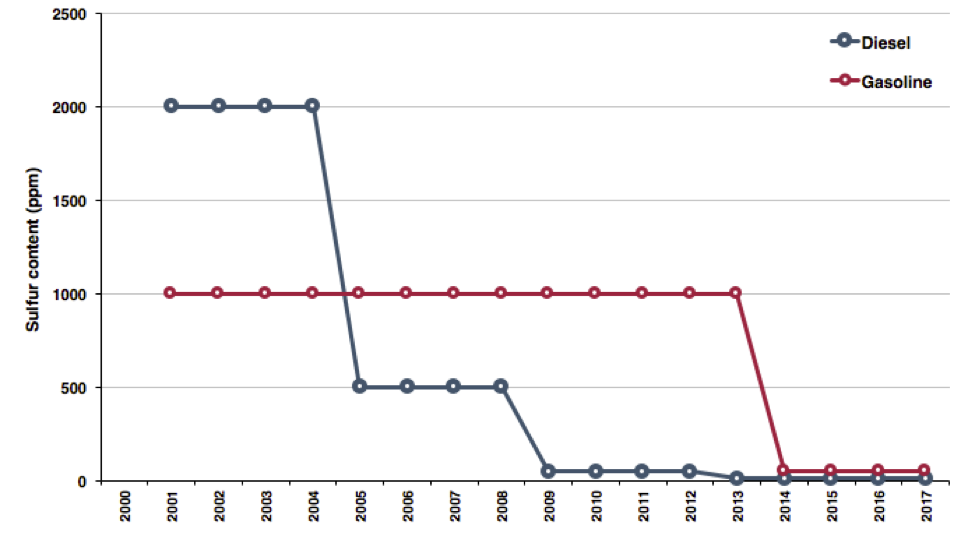
Maximum sulfur content of diesel and gasoline allowed in São Paulo, 2001–2015. [Source]
These emission reductions are reflected in the air quality data, too: as shown in the figure below, between 2001 and 2015—the most recent year for which measurements are publicly available—the average 24-hour SO2 concentration also dropped more than 80%. This reduction was observed for each of three measurement stations with continuous coverage between 2001 and 2015. Over this same period, the share of 24-hour measurements exceeding the World Health Organization (WHO) guideline for short-term exposure to SO2 dropped from 27% in 2001 to less than 1% in 2015. (Since 2008, all daily measurements at these stations have been below São Paulo’s laxer SO2 guidelines.)
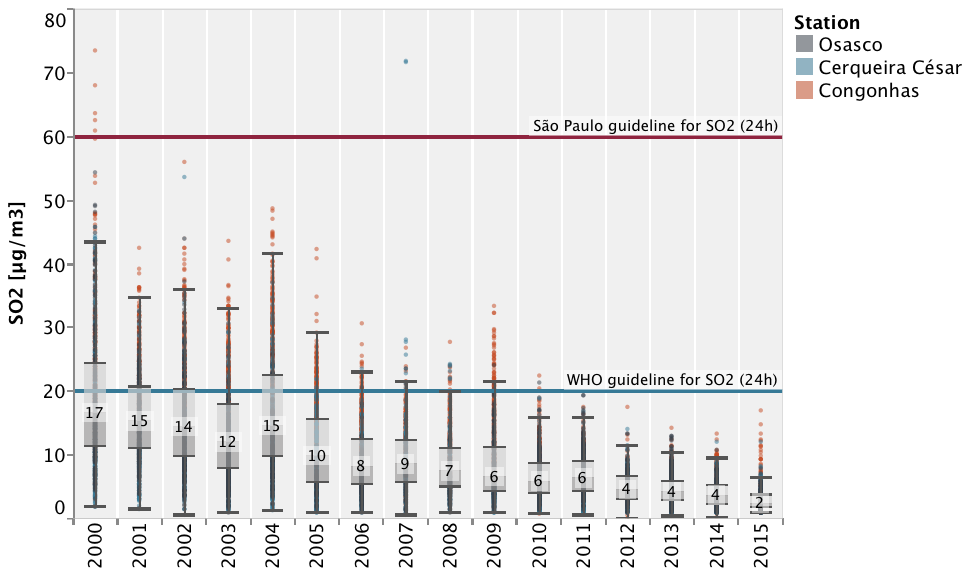
Average 24-hour SO2 concentration in São Paulo, 2000–2015. [Source] a, b
Annual average particulate concentrations have also fallen in recent years, which can be partly attributed to tightening PROCONVE standards. In 2001, motor vehicles and industrial sources each emitted more than 30,000 tons of PM10. By 2014, estimated PM10 emissions had declined to an estimated 1,500 tons from vehicles and 3,600 tons from industrial sources, equivalent to an 83% reduction (Note, as above, that CETESB’s emissions methodology for motor vehicles changed in 2010). This progress has led São Paulo to comply with local air quality guidelines for particulate matter (PM10), but annual particulate concentrations still exceed the WHO’s guideline by a factor of 1.5 (see figure below). This indicates that PM10 concentrations need to be reduced by a third to bring São Paulo’s annual average PM10 concentrations down to safe levels.
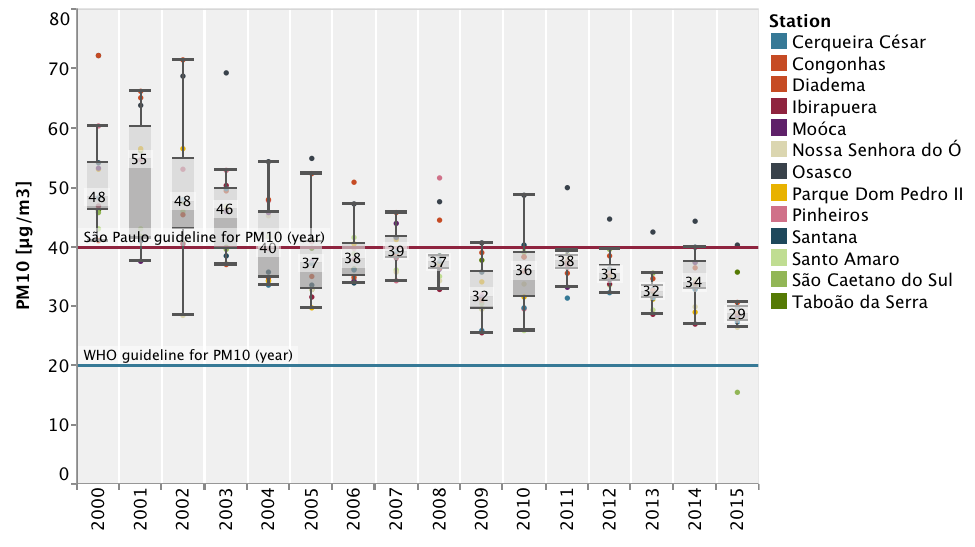
Annual average PM10 concentration in São Paulo, 2000–2015. [Source] a, b
Implementing P-8 (Euro VI-equivalent) standards for trucks and buses might be the most cost-effective way to improve air quality, not just in São Paulo but nationwide. First, diesel trucks and buses represent two thirds of direct PM10 emissions (excluding resuspended and secondary PM, which CETESB assumes account for half of PM10 concentrations). Trucks and buses also represent more than 40% of NOX emissions, which are precursors to secondary PM and ozone. And since P-8 standards would reduce both PM and NOX emissions by 90% compared to current P-7 vehicles, they would reduce concentrations of directly emitted PM as well as secondary PM. The benefits associated with P-8 standards outweigh their costs by a ratio of 11 to 1. These air quality benefits can be accelerated through well designed complementary programs that encourage fleet renewal. As the share of activity by P-8 vehicles increases, São Paulo’s air quality monitoring network will have an even better story to tell.
a) Each box shows the median result of the air quality indicator along with the first and third quartiles. By definition, 50% of the air quality measurements fall within the boundaries of this box. The whiskers are defined as 1.5 times the interquartile range (the difference between the first and third quartiles), which is a common statistical approach for identifying outliers. For a normally distributed data set, 99% of the measurements would be expected to fall within the boundaries of the whiskers.
b) The monitoring stations were screened using criteria for data coverage and absence of nearby industrial sources (which could have a disproportionate effect on air quality measurements). We identified four monitoring stations with continuous coverage for SO2 between 2000 and 2015 (i.e., monitoring not interrupted or stopped for more than 2 years in a row). Three of these stations were deemed by local agencies to be representative of an urban environment (one was excluded due to proximity to major industrial stationary sources). These same screening criteria were applied to identify 13 qualified stations for PM10. These stations are in the central areas of São Paulo, which have a high concentration of transportation activities.