Blog
A trend that can’t continue: The gap between official and real CO2 reductions from Europe’s passenger car fleet keeps growing
Our report last year documenting the worsening gap between official, test-based CO2 emissions from Europe’s passenger cars and what drivers actually experience on the road received a lot of attention from policy makers, vehicle manufacturers, and the press. It was the first time that anyone had conclusively demonstrated that the gap had been widening consistently in recent years and that, while the problem was systematic, there were significant differences among individual manufacturers.
We’ve just released “From Laboratory to Road: 2014 Update,” which, as the title suggests, extends and builds on the analysis in that 2013 study of the same name. It follows the same approach as last year, making use of the “law of large numbers”: while everyone drives differently, large sets of on-road driving data generally resemble a normal distribution and allow us to draw conclusions about trends over time for the average vehicle fleet. And when I say “large numbers”, I mean really large numbers! This year we analyzed data for more than half a million vehicles, from eight different data sources, including consumer websites, car magazines, leasing companies, and car clubs.
The bad news: the data show that the difference between on-road and official CO2 values continues to increase, and at an accelerating rate. For private cars, we estimate that it rose from around 8 percent in 2001 to 31 percent in 2013. That is, under real driving conditions, new, privately-owned cars emit, on average, one-third more CO2 than they should according to the official values. For company cars (a large proportion of the fleet in Europe, where employers often purchase a vehicle for an employee and even pay some or all of the operating expenses) the gap is even greater, 45 percent in 2013. Instead of CO2,we could describe the performance gap in terms of fuel consumption, because they are directly proportional. 31 percent higher CO2 emissions translates into 31 percent more fuel consumption—which means, in practical terms, annual fuel expenses that are approximately €450 higher than they should be for an average consumer.
There are many other implications beyond additional costs for the consumer. Notably, countries where vehicle taxes are largely based on the official CO2 emission values, like the Netherlands, are forgoing significant tax revenues without the corresponding achievement of real-world reductions in greenhouse-gas emissions from cars that they think they are getting.
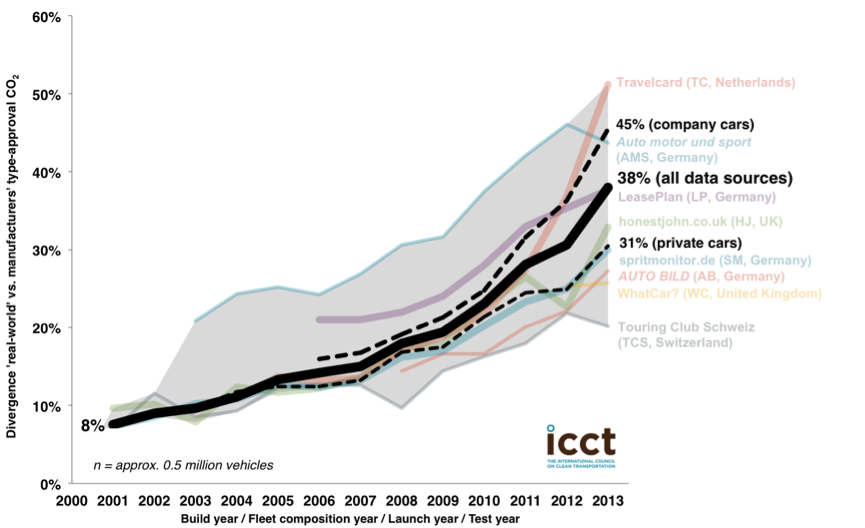
Fig. 1. Increasing gap between real-world and official CO2 emissions / fuel consumption for new cars in the EU (data sources for more than half a million vehicles in total)
For me, the most fascinating part of our 2014 report is the analysis of individual vehicle models. This is the first time that anyone has examined this data at such a detailed level. What we find are some remarkable trends that can help to better understand why the gap has grown and is still growing at an accelerating rate.
To illustrate, take the VW Passat. (Not to suggest that the Passat is different from other models where we observe the following developments – it is simply a typical model sold in high volumes.) The difference between the official so-called type-approval CO2 values and the on-road driving data we derived from the German consumer website spiritmonitor.de for the Passat was usually around 10 percent from 2001 until 2010. In fact, the gap even decreased slightly through 2009. Then, in 2010, Volkswagen introduced a new generation of the Passat, and for 2011 the gap jumped to more than 30 percent (in 2010 the spritmonitor.de data includes a mix of the “old” and the “new” Passat, whereas in 2011 nearly all data are for the “new” Passat). So what happened? Driving behavior and other external factors certainly did not change within one year. The only plausible explanations are changes in technology and increased use of flexibilities in the current test procedure (the New European Driving Cycle, or NEDC).
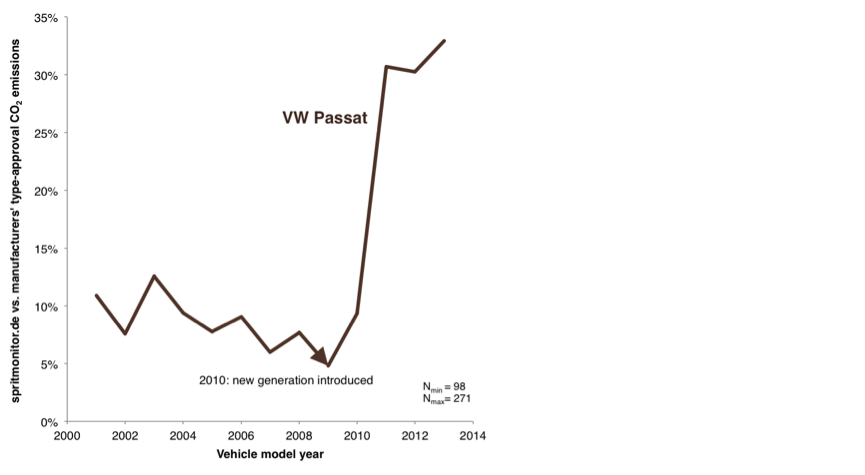
Fig. 2. Gap between real-world and official CO2 emissions / fuel consumption for the VW Passat (based on ICCT analysis of spritmonitor.de data).
As I said, the VW Passat is definitely not the only vehicle where we find such sudden changes in the gap with the introduction of a new vehicle generation. In fact, we carried out a similar analysis for 26 of the top-selling vehicles in the EU. The result is summarized in the chart below. For vehicle model changes that occurred before 2009, we found that each time a new generation came on the market the average gap increased from 12 percent to 17 percent of the official CO2 value from one year to the next. For more recent model changes—after the EU CO2 regulation for new cars was introduced in 2009—we found that the typical increase in the gap from one generation to the next jumped even more, from 18 to 29 percent.
When I look at this chart, it reminds me very much of similar results I found in analyses of the inertia classes that are used in the NEDC instead of the actual weight of a vehicle – we called it the dead-hand-of-the-past-phenomenon. Like that analysis, this chart strongly points to the conclusion that the increasing gap is actually the result of many discrete increases whenever a new model generation is introduced into the market. It is also another indicator that changes in driving behavior and external factors likely explain only a relatively small portion of the growing gap that we observe.
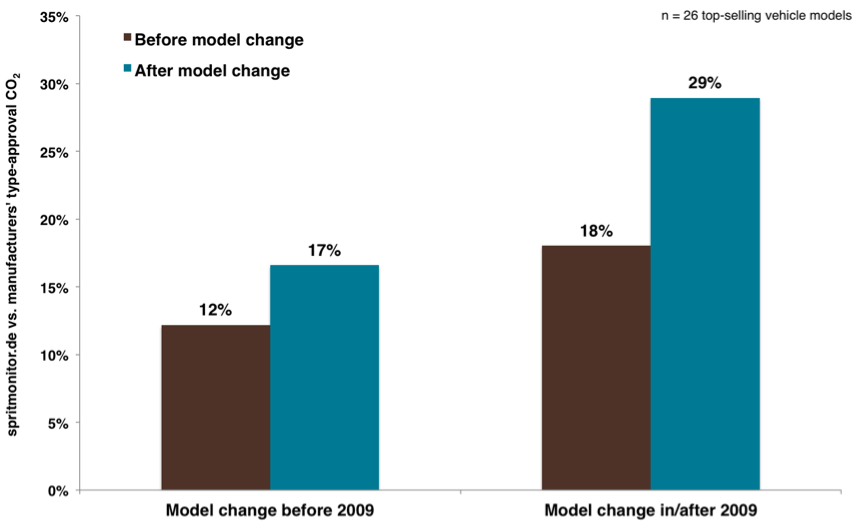
Fig. 3. Average gap for the 26 top-selling vehicle models in the EU, immediately before and after introduction of a new model generation or major facelift.
So what is the solution? How can we ensure that the official CO2 figures will come back into line with the real-world performance of our vehicles on the road? One important element is the test procedure. A new, improved procedure (the so-called WLTP) has already been developed and adopted by a United Nations working group. The European Commission is currently working on its implementation in the EU and, if EU Member States agree, this new test procedure will come into effect by 2017. (See here for a summary, and here for much, much more detail).
The new testing procedure will certainly help, but it still means testing vehicles in the laboratory, under necessarily artificial conditions. To ensure realistic CO2 and fuel consumption figures, we at the ICCT think it is necessary to complement the laboratory tests with actual on-road driving tests and—very important—to introduce an in-service conformity program in the EU. This will ensure that, instead of just testing one special test vehicle from a group of vehicles, every single vehicle sold to consumers can randomly be selected for testing and validation by the authorities. (See here for a longer argument on how this works and why it’s important).
But the critical first step is to introduce the WLTP in the EU as soon as possible. With our 2014 real-world fuel consumption report, there is even more evidence than before that this new test procedure is urgently needed.