Blog
Bending the law of diminishing returns on fuel economy
Larry Vellequette had an interesting column about diminishing returns from vehicle efficiency technologies in the July 11, 2014 Automotive News. He was commenting on the chart below showing annual fuel consumption versus miles per gallon, which had been posted earlier that day by the U.S. Department of Energy’s Energy Information Agency.
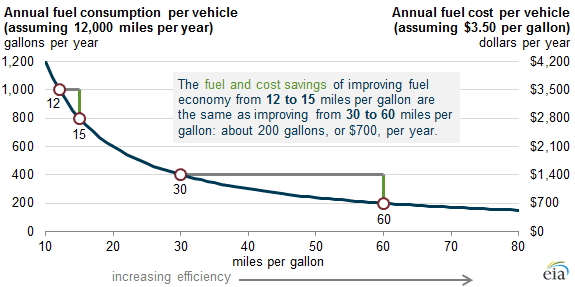
Everybody in this policy area knows this chart well. It shows that as the baseline fuel economy goes up, the incremental fuel savings from the next round of reductions goes down. Part of this is due to using mpg instead of fuel consumption. Fuel consumption (e.g., gallons per 100 miles) is the proper metric, and mpg, like all inverse relationships, explodes as fuel consumption approaches zero (see my earlier blog here discussing the problem). But beyond the question of the metric, the simple fact is that a more efficient vehicle consumes less fuel per mile. This means, for example, that a 5 percent improvement on a vehicle that consumes 2 gallons per 100 miles (50 mpg) yields only half of the fuel savings of improving a vehicle that consumes 4 gallons per 100 miles (25 mpg) by 5 percent. So, Vellequett’s discussion of the diminishing returns is accurate.
But there is still a fundamental mistake in the conclusion that Vellequette wants to draw from the EIA chart, which is that he does not consider the cost of adding the technology and, thus, implicitly assumes that costs will remain constant. What really matters is the cost of adding more technology compared with the fuel savings from the technology.
It’s an understandable problem, as there have been few, if any, reports published on the declining cost of technology over time and it is easy to just assume that costs remain relatively constant. And it is really difficult to calculate a reliable $/mpg number, as technology can be used to either improve vehicle efficiency or to maintain efficiency while improving other vehicle attributes, such as faster acceleration or adding weight for features desired by customers. In fact, in the past technology has been used primarily to improve performance and add consumer features, rather than to improve efficiency, which makes it that much harder to calculate a $/mpg number. But all the evidence points to technology costs falling fast enough to keep pace with the law of diminishing returns; in the past, currently, and in the future. Here’s why I say that.
For a historical perspective, EPA’s 2013 fuel economy trends report contains fleet average data from 1975 to 2013. The average fuel economy for cars and light trucks combined almost doubled between 1975 and 2013, rising from 15.3 mpg to 30.3 mpg. This occurred even though light truck market share increased from about 20% to about 45%, installation of more efficient manual transmissions dropped from 23% to 5%, and 0–60 acceleration times dropped from 14.1 seconds to 9.3 seconds. If the 2013 fleet were adjusted to the 1975 fleet mix, weight, percent manuals, and performance, fuel economy in 2013 would have been 35–36 mpg, or about a 133% increase in efficiency compared with 1975.
Especially dramatic has been the increase in engine power per engine size. Despite a 39% reduction in engine size since 1975, horsepower increased by 68%. Power density, HP per liter of engine displacement, increased from 28.5 in 1975 to 78.4 in 2013—a staggering 2.75 times increase. While a small part of this is turbocharging, only 15% of 2013 engines were turbocharged, so most of this increase is simply due to better engine technology. If the same improvement were to occur from 2013 to 2050 and the horsepower level remained constant, the average engine size in 2050 would be only 1.1L, including light trucks. Although, given the continuing developments in high-pressure turbocharging, this may actually be quite feasible.
So, after 120 years of development and all the improvements over the last 40 years, the internal combustion engine must be tapped out, right? Actually, there is a revolutionary technology that is transforming how vehicles are designed and built and accelerating improvements and cost reduction. It’s the computer. Computer-aided design, computer simulations, and on-board computer controls are enabling technology improvements that previously were simply not possible. This is impacting every aspect of engine design, including better combustion design, higher compression ratios, lower engine friction, smaller engines with direct fuel injection and turbocharging, variable valve timing, and more efficient cooling systems and accessories. It is impacting transmission design, with over 80% of 2013 vehicles equipped with a transmission of six or more gears or a continuously variable transmission, accelerating introduction of nine- and ten-speed transmissions, and introduction of manual transmissions that are shifted by the computer like a conventional automatic. It is impacting aerodynamic drag and tire rolling resistance, with more slippery body shapes and lower-rolling-resistance tires.
And it is especially impacting lightweight vehicle design. Any time a part is changed, it interacts with hundreds of other parts and has impacts on crash performance, noise, vibration, ride, and handling. These interactions are extremely complex, and it used to be impossible to predict what the impacts would be. Thus, trying to redesign a vehicle with lightweight components was a lengthy, expensive process of changing some parts, building up a prototype vehicle, and actually testing it. But now, computer simulations of these interactions are improving rapidly. They were developed initially to improve crash performance on the various NHTSA and IIHS crash tests—and have been so successful that NHTSA had to change its rating criteria a few years ago because almost every vehicle was achieving a 5-star crash rating. The simulations are continuing to improve and are just now starting to be capable of optimizing the material, shape, and thickness of every part on the vehicle simultaneously. Sure, the manufacturer still has to build a prototype to ensure that the simulations were accurate, but the scope of what can be done has increased by orders of magnitude. The poster child for this revolution is the aluminum body on the 2015 Ford F150 pickup truck, which I blogged about here.
The bottom line is that the benefits of technology should not be viewed in isolation. Certainly technology benefits are diminishing, as discussed by Vellequette and EIA. But costs are also diminishing, and the pace of technology development is accelerating. There will come a day when efficiency is so high and most of the technology improvements have been wrung out of the vehicles, such that diminishing returns will actually matter. But that day is decades away.
And, who knows? A recent National Academy of Sciences report predicted that in the 2045 time frame both battery-electric vehicles with a 100-mile real-world range and fuel cell vehicles would be cheaper than conventional vehicles. If the costs of improving efficiency are negative, then diminishing returns doesn’t matter.
One final point, which is that efficiency or CO2 regulations are needed to keep moving up the technology ladder. Absent regulations to force the choice to go in favor of increased mpg instead of other consumer attributes, you’re not so likely to achieve the efficiency gains no matter what’s happening to the underlying costs.