Blog
Another look into the crystal ball at the IMO
About this time last year, I predicted that the International Maritime Organization (IMO), the United Nations agency based in London that oversees international shipping, could take sweeping action on climate change before London’s historic rival city across the channel, Paris, hosted the next Conference of Parties (COP 21) this winter. At that meeting countries have to agree upon a new deal to curtail climate change or see the decades-long effort fall apart.
Since last year the pendulum has swung in the opposite direction. Momentum for coordinated action on climate change was greatly reinvigorated by the pact committing China and the U.S., the two biggest polluters globally, to jointly curtail greenhouse gas (GHG) emissions. Meanwhile, the active technical collaboration in energy efficiency that has been the hallmark of the IMO, and which propelled the passage of the Energy Efficiency Design Index for new ships, has gradually lost steam amidst political infighting.
The most important reason for the gridlock at the IMO, perhaps counterintuitively the same reason behind revitalization of the prospects for COP21, is the difficulty in forming a critical mass of willing collaborators. Although the UNFCCC gets bogged down in the struggle to achieve consensus, China, the European Union, and the U.S., which together account for more than half of world GHG emissions, exert outsized influence over the process. When the Big Three finally see eye-to-eye with each other, the path to a global climate change deal suddenly looks clearer. In the IMO things are less clear-cut, because of the deeply fragmented structure of the shipping industry. A crude oil tanker, for example, may be owned by a Greek firm, managed by a UK-based company, registered in Panama, and load oil in Saudi Arabia destined for Japan. Every country has an interest in shipping; none is dominant.
The fragmented nature of shipping, and its implication for coordinated actions on climate change, can be illustrated by assigning shipping carbon dioxide (CO2) emissions to individual countries based upon varying criteria. The four cartograms below show a world map with countries/regions resized according to 2012 CO2 emissions by ship registration (mid left), ownership (mid right), builder (bottom left), and engine manufacturer (bottom right), along with a base map for reference (top). Countries with the most ships registered barely match those truly owning the fleet; and countries building most ships are not designing their engines. Consequently, countries keen to advance an environmental agenda at the IMO can find themselves disoriented when it comes to identifying allies. Even these countries are divided, as shown by the continued sparring over how to measure marine black carbon, a potent short-lived climate forcer that is thousands of times more powerful than CO2 in the near term.
The division is exacerbated by economic forces. The shipping industry has been under economic pressure for years, dragged down by sluggish global trade, an oversupply of ships, and high energy costs. The freight rate, a key metric for the health of the business, has been teetering on the brink of collapse since the beginning of last year, after stagnating for years. To make matters worse, the economic hardship in maritime states such as Greece has wiped out capital, key to financing for expensive ships, which is the lifeline of shipping companies. Prolonged slow growth has dampened expectations of a long-overdue recovery and caused many to resist additional environmental regulations that could increase costs to the industry.
One of the knock-on effects of inaction at the IMO is that CO2 emissions from shipping are set to grow, as shipping activity continues to climb. If it were a country, international shipping would have ranked sixth globally in terms of 2011 CO2 emissions, and according to the IMO emissions are likely to increase by 150% by 2050, a time frame in which many countries are eyeing 60 to 80% reductions in greenhouse gases. As energy costs plummet the practice of slow steaming, which kept a lid on CO2 emissions from ships in recent years, may taper off. Other practices that reduce fuel use in operation, such as propeller polishing, hull cleaning, and weather routing, may also tail off as fuel prices drop. Countries with significant shipping interests, small in size and thus more vulnerable to capture by narrow self-interests (see the charts on the top), seem neither willing nor able to curb CO2 emissions.
Looking ahead, it may be another rudderless year at the IMO. The shipping industry faces a difficult route to recovery. The recent plunge in oil prices has provided a relief valve, but lackluster global trade points to continued weak growth. The disparity of effort in addressing GHGs between countries seems likely to persist, if not widen. Things may change, though, if momentum builds within wider international climate-change negotiations, and as the EU moves forward with its own emissions reporting requirements for the marine sector. I’d be more than happy to get my predictions wrong again.
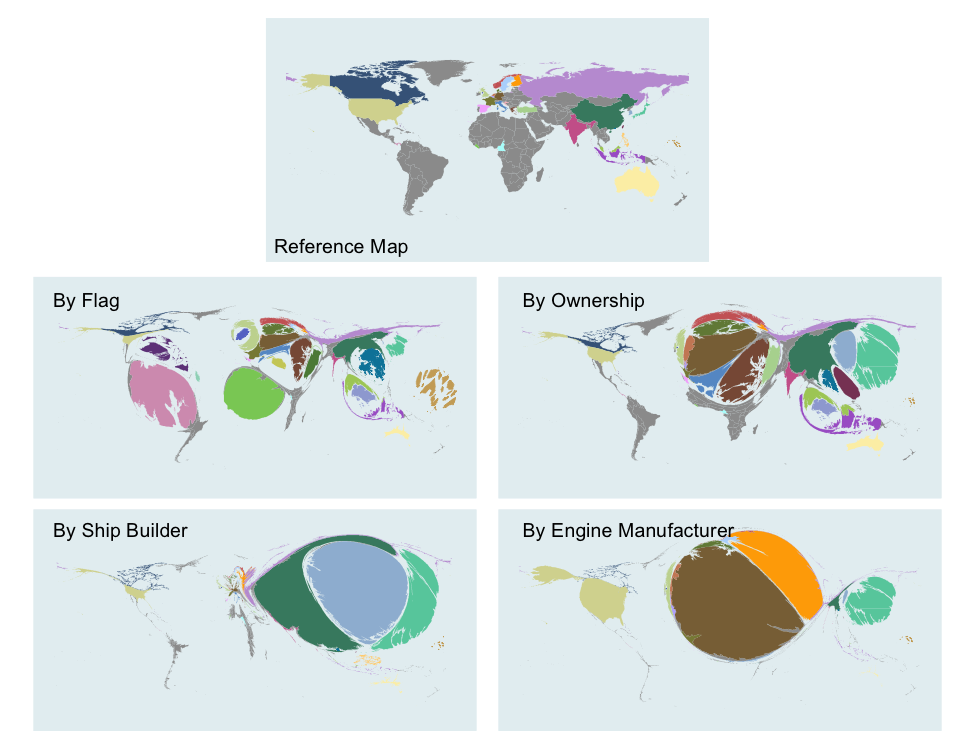
World map resized according to 2012 marine CO2 emissions allocated by ship registration (mid left), ownership (mid right), builder (bottom left), and engine manufacturer (bottom right).