Blog
Top vehicle markets, 2012
Our annual look at the largest vehicle markets, in words and pictures (see here for last year’s). Thanks to my colleagues Hui He for help with the Wards data, Zifei Yang for coming up with the top 15 vehicle listing and comparison charts, and Sarah Chambliss and Chris Malins for the cartogram.
Total vehicle (passenger plus commercial) sales increased by 5.75% from 2011 to reach a new all-time high of 77.4 million units. 2011 sales were revised upwards to 73.2 million units.
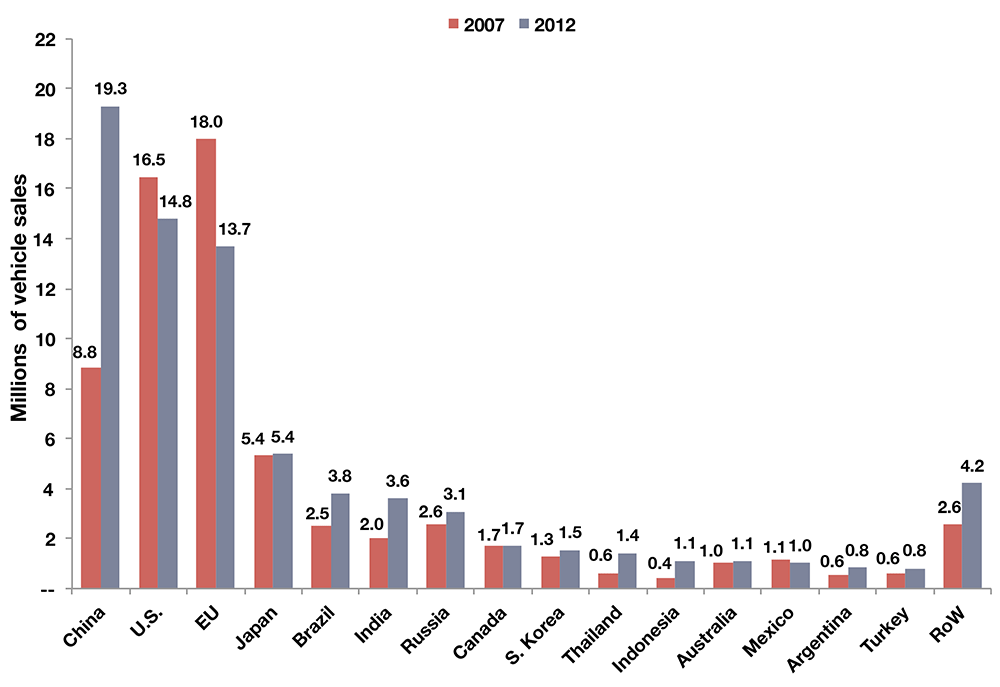
Once again, the continuing rebound in U.S. vehicle sales (+1.8 M) contributed to this robust vehicle sales growth (+4.2 M). As expected, the U.S. has regained number two spot behind China, where vehicle market grew by a modest 4.3% (note that that’s below the global average) to 19.3 million units. The U.S. market is currently on track to be within shouting distance of 16 million unit sales for 2013—something I didn’t imagine would happen before 2015 or even 2016.
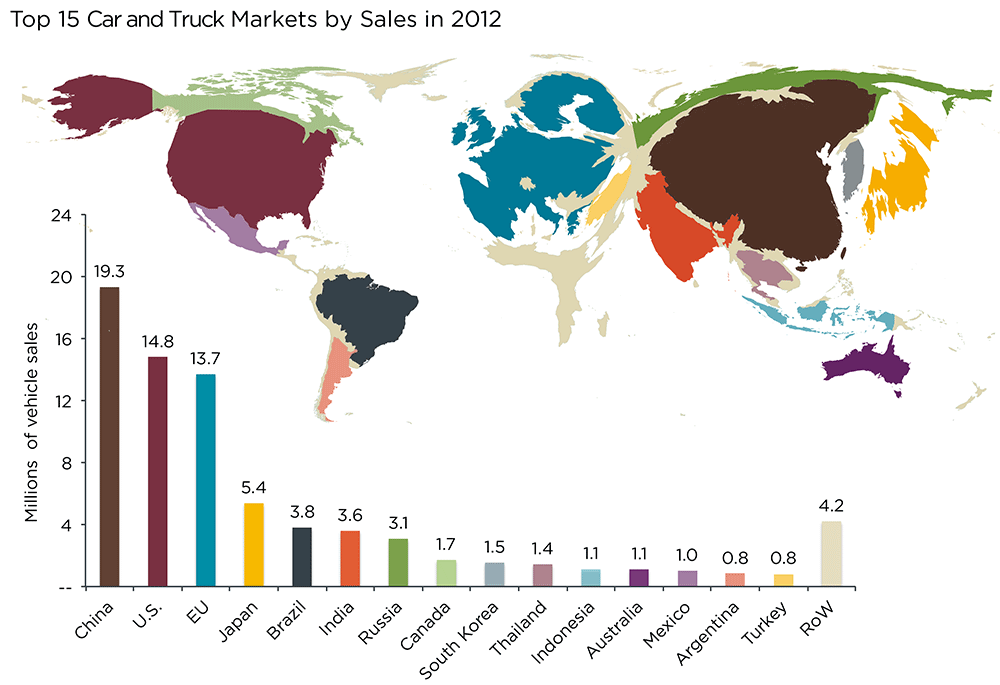
The Japanese vehicle market, recovering from the Great East Japan Earthquake, also increased by 1.2 M units. Dismal EU sales (-1.2 M) offset this gain. The 2013 EU sales are going to drop another 10% or so from this 2012. One wonders if there is one more year left in the EU downturn story, but I suspect that the 2013 will mark the bottom for the EU vehicle sales, much as 2009 was rock bottom for the U.S. auto industry.
Brazil, India, Russia registered 4%, 8%, and 10% sales growth respectively, but maintained their respective positions in the list. Even though the gap between Brazil and India has shrunk further, given the soft economy in India this year we should not expect to see the countries change their respective position in the chart for another couple of years.
As some of you will have noticed, our list of top markets has grown from ten (and last year’s awkward eleven) to fifteen. Two reasons. One is that one of the traditional big markets, Mexico, has fallen all the way down to #13 on the list—not so much because sales dropped there, but because other markets are growing at a breakneck speed. Indonesia grew by 24% last year (20% growth rate over the past five years). That is more than China’s growth rate over this period! So, I was wrong. The other jaw-dropping growth story comes from Thailand, where sales, after years of hovering around 600-750K, jumped by a whopping 80% to 1.4 million units. Many of these sales were on the back of generous tax incentives offered by the Thai government after the devastating floods of 2011. Through the end of July 2013, Thai vehicle sales were up by some 13% compared with 2012 sales (source: Thai Auto Book). It is not clear if sales there will be as strong in the second half, but it is quite likely that Thailand may displace South Korea to take the #9 spot in the 2013 list.
The second reason is that the share of the global market represented by the top ten markets is now down to 88%, although the top 15 countries now comprise of 95% of the global sales. We can expect the present top 15 countries to be in this chart for the next few years as well.